Evaluation of craniofacial morphology in short-statured children: growth hormone deficiency versus idiopathic short stature
Article information

Abstract
Background
Short stature is defined as a height below the 3rd percentile or more than two standard deviations below the mean for a given age, sex, and population. There have been inconsistent results regarding craniofacial morphology in short-statured children. This study aimed to analyze the differences between short-statured children with growth hormone deficiency, idiopathic short-statured children, and normal children.
Methods
Thirty-one short-statured children with growth hormone deficiency, 32 idiopathic short-statured children, and 32 healthy children were enrolled in this study. The measurements of their craniofacial structures from lateral cephalograms were evaluated.
Results
There were statistically significant differences among the three groups seven variables (anterior cranial base length, posterior cranial base length, total cranial base length, upper posterior facial height, posterior total facial height, mandibular ramus length, and overall mandibular length) in the linear measurement and five variables (saddle angle, gonial angle, mandibular plane angle, position of mandible, and maxilla versus mandible) in the angular measurement.
Conclusion
Compared to the control group, many linear and angular measurements of the craniofacial structures were significantly different in the two short-statured groups (p<0.05). Treatment plans by orthodontists should include these craniofacial structure characteristics.
Introduction
Heightism is a newly invented word that combines “height” and “ism”, and it refers to the privilege enjoyed by those with tall stature. Nicholas Herpin, a French sociologist, says in his book ‘Le Pouboir des grands’ that a man’s big height works in favor of his status, salary, love, marriage, and many other factors, and his height is a power [1].
In Korea, parents with growing children are often concerned about their child’s final height. In a survey conducted by the Korean Society of Pediatric Endocrinology, found that Korean parents considered the ideal final height of their children to be over 175 cm and less than 180 cm (46.6%, 178/382 persons), with over 180 cm (42.7%, 163/382 persons) for males, and over 165 cm to less than 170 cm (54.6%, 532/975 persons), followed by 160 cm to less than 165 cm (36.5%, 356/975 persons) for females. This exceeds the average height of 20 to 29-year-old males and females in Korea, of 174.1 cm and 161.6 cm, respectively. In addition, parents said they were concerned that a short stature would be unfavorable to their child’s social life and interpersonal relationships [2].
Short stature is defined as a height below the 3rd percentile or more than two standard deviations below the mean for a given age, sex, and population [3]. The causes of short stature can be divided into three broad categories: chronic disease (including undernutrition, genetic disorders), familial short stature, and constitutional delay of growth and development. Most children with short stature have normal variants such as familial short stature, constitutional delay of growth and puberty, or idiopathic short stature. Approximately 5% of children referred for evaluation of short stature have an identifiable pathologic cause. The most common etiologies are growth hormone deficiency, hypothyroidism, celiac disease, and Turner syndrome. Other causes include renal, hepatic, gastrointestinal diseases, and other genetic syndromes such as Noonan syndrome and Leri Weill syndrome [4-9].
In past studies of craniofacial bones for short-statured children, inconsistent results regarding the growth of the cranial base were reported [10-12]. However, recent literature showed that the dimensions of the craniofacial structures were smaller in short-statured children [13,14].
There has not been a clear explanation of the craniofacial morphology by cause in short-statured children with growth disorders. Many issues need to be considered by orthodontists treating short-statured children.
This study aimed to analyze the differences in craniofacial morphology between short-statured children with growth hormone deficiency (SS-HD), idiopathic short-statured children (SS-I), and normal children (NC). These findings could provide basic information for developing orthodontic treatment protocols for short-statured children.
Materials and methods
1. Subjects
This study received approval from the Institutional Review Board of Yeungnam University Hospital (IRB No: 2019-03-007-001). All participants and their parents gave their informed consent.
Children diagnosed with short stature between 2006 and 2012 at the Department of Pediatrics, Yeungnam University Hospital, Daegu, Korea, were eligible for this study. Patients and their parents were asked if measurements of their craniofacial structures could be taken by an orthodontist at the Department of Dentistry, Yeungnam University Hospital. Those who agreed were referred to the Department of Dentistry.
All participants of the case group were classified into two subject groups: 31 SS-HD and 32 SS-I. Paired sampling was used to match the 31 SS-HD subjects with the SS-I subjects in terms of age and sex.
The control group consisted of 32 NC who had visited the dental clinic in Daegu (paired sampling was used to match the 31 SS-HD subjects in terms of age and sex). All of them had an Angle’s class I malocclusion and arch length discrepancy less than 3 mm.
2. Methods
1) Demographic characteristics
Age and sex were provided in the medical records of the short-statured subjects and the chart records of the normal subjects.
2) Cephalometric analysis
In all participants, lateral cephalograms were taken by a single dentist and a single dental hygienist with their teeth in maximum habitual intercuspation with relaxed lips and face positioned with the Camper’s plane parallel to the ground. Twelve cephalometric reference points were identified (Table 1, Fig. 1). Then, using these, 12 linear and seven angular cephalometric measurements were taken to evaluate the craniofacial morphology (Table 2) [15].

Twelve cephalometric landmarks
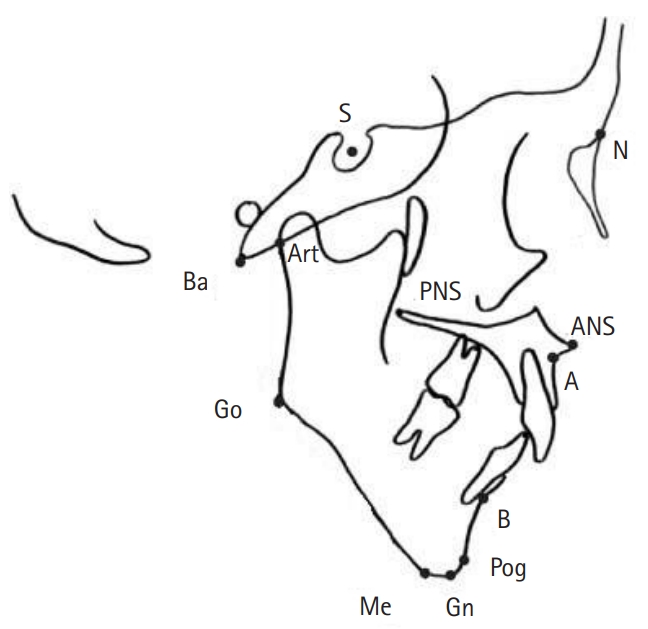
Cephalometric landmarks. S, sella; N, nasion; Ba, basion; Art, articulare; PNS, posterior nasal spine; ANS, anterior nasal spine; Go, gonion; A, subspinale; B, supraentale; Pog, pogonion; Me, menton; Gn, gnathion.

Linear and angular craniofacial measurements
3) Statistical analysis
Statistical analysis was performed using IBM SPSS version 19.0 (IBM Corp., Armonk, NY, USA). According to the variables, a frequency analysis and multivariate analysis of variance (ANOVA) with Bonferroni correction were used to compare the characteristics of the groups. A p-value of <0.05 was considered statistically significant.
Results
1. Demographic characteristics of the study subjects
A total of 95 children participated in this study, and the general and physical characteristics of each group are shown in Table 3. The number, sex, and age of each group were as follows: 31 SS-HD, 16 males and 15 females, mean age, 10.35±1.84 years; 32 SS-I, 16 males and 16 females, mean age, 10.31±1.82 years; and 32 NC, 17 males and 15 females, mean age, 10.31±1.82 years, respectively.

Demographic characteristics of subjects
2. Cephalometric analysis
Comparison of the linear and angular craniofacial variables among the SS-HD, SS-I, and NC groups are shown in Tables 4 and 5.

Comparison for the linear craniofacial variables among SS-HD, SS-I, and NC groups

Comparison for the angular craniofacial variables among SS-HD, SS-I, and NC groups
Regarding the linear measurements, there were significant differences in seven variables among the SS-HD, SS-I, and NC groups (p<0.05). In the two groups, mandibular ramus length (MandRL) were 36.10±0.57 and 37.22±0.67, and overall mandibular length (OMandL) were 96.50±0.79 and 99.52±0.75, respectively. There were all statistically significant (p<0.05). Significant differences between the SS-HD and NC groups were apparent at anterior cranial base length (ACB), posterior cranial base length (PCB), total cranial base length (TCB), upper posterior facial height (UPFH), posterior total facial height (PTFH), MandRL, and mandibular corpus length (MandCL) (p<0.05). Significant differences between the SS-I group and NC group were apparent at ACB, PCB, UPFH, MandRL, and MandCL (p<0.05).
Regarding the angular measurements, there were significant differences in five variables among the SS-HD, SS-I, and NC groups (p<0.05). In the two groups, gonial angle (GA) were 127.39±0.51 and 125.38±0.28, position of mandible (SNB) were 75.03±0.42 and 76.47±0.36, and maxilla versus mandible (ANB) were 4.39±0.17 and 3.28±0.13, respectively, all of which had statistical significance (p<0.05). Significant differences between the SS-HD and NC groups were apparent at saddle angle (SA), GA, mandibular plane angle (MPA), position of maxilla (SNA), SNB, and ANB (p<0.05). Significant differences between the SS-I and NC groups were apparent at MPA, SNB, and ANB (p<0.05).
Discussion
Mechanisms that regulate the growth and development of craniofacial regions are expressed by the complex interaction of genes, hormones, nutrition, and epigenetic factors. Interference with these mechanisms can cause changes in growth patterns [16,17].
The relationship between the development of the craniofacial structures and body structures has been shown in various growth studies [18-20]. The study by Chung et al. [21] reported that growth retardation in short stature children affected not only their height but also their craniofacial growth.
In this study, we classified short-statured children into two groups, growth hormone deficient or idiopathic, and compared the characteristics of their craniofacial growth with NC.
This study found that both short-statured children with growth hormone deficiency and idiopathic short-statured children were affected not only in terms of height but also craniofacial growth. Compared to the control group, almost all of the craniofacial structure measurements were significantly different. There was a more disproportionate growth of the cranial base, and jaw which resulted in facial retrognathia in the two short-statured groups.
Both short-statured groups had a shorter cranial base length. This was consistent with the results of van Erum et al. [22], but inconsistent with the results of Spiegel et al. [10], Kjellberg et al. [13], and Poole et al. [23].
The PTFH, MandRL, and OMandL values of the two short-statured groups were higher than the control group. This could be seen in the small mandible and reduced posterior facial height, which might cause the mandible to rotate in short-statured children. Contrastingly, the GA and MPA values of the two short-statured groups were lower than the control group. This could also be seen by the growth pattern of the mandible rotating clockwise in short-statured children. This incongruity of the upper and lower jaws can lead to skeletal malocclusion, thereby requiring orthodontic treatment for tooth occlusion, oral function, and temporomandibular joint issues. The growth pattern of both jaws should also be considered at this time.
There are several limitations to this study. All subjects should be investigated according to sex and age because there are differences between males and females, and the time and amount of growth with age [24]. Besides, the number of participants included in this study was rather small. Therefore, further studies should be conducted with more children that are analyzed according to sex and age, as well as the short stature cause. Despite these limitations, this study is significant in that it identified differences in the development of craniofacial structures in short-statured children.
In conclusion, most of the measurements of craniofacial structures were significantly smaller in both growth hormone-deficient and idiopathic short-statured children. Orthodontic treatment plans should be modified to include these craniofacial structure characteristics.
Notes
Conflicts of interest
No potential conflict of interest relevant to this article was reported.
Author contribution
Conceptualization, Data curation: all authors; Formal analysis, Methodology: EYP, KBK, EKK; Project administration: EYP, KBK; Investigation: all authors; Resources: EYP, KBK, MSK; Software: EYP, EKK; Supervision: EYP; Validation: EYP, KBK, EKK; Visualization, Writing–original draft, Writing–review & editing: EYP, KBK.