Association of advanced chronic kidney disease with diabetic retinopathy severity in older patients with diabetes: a retrospective cross-sectional study
Article information

Abstract
Background
Despite the recent increasing trend in the prevalence of type 2 diabetes among older individuals, the relationship between diabetic retinopathy (DR) and chronic kidney disease (CKD) in these patients remains unclear. This study investigated the severity of renal dysfunction according to the degree of DR in older patients with type 2 diabetes.
Methods
A total of 116 patients with diabetes and CKD stage ≥3 who visited both the nephrology and ophthalmology outpatient departments between July 2021 and January 2022 were screened. There were 53 patients in the no DR group, 20 in the nonproliferative DR (NPDR) group, and 43 in the proliferative DR (PDR) group.
Results
DR severity was related to the deterioration of renal function. The proportion of patients with advanced CKD significantly increased with DR severity (p for trend <0.001). In the multivariate regression model adjusted for age of ≥80 years, male sex, poorly controlled diabetes, macroalbuminuria, insulin use, diabetes duration of ≥10 years, cerebrovascular accident, hypertension, hyperlipidemia, and cardiovascular disease history, the odds ratio compared with the no DR group was approximately 4.6 for the NPDR group and approximately 11.8 for the PDR group, which were both statistically significant (p=0.025 and p<0.001, respectively).
Conclusion
DR severity in older patients with diabetes may be associated with deterioration of renal function and high prevalence of advanced CKD. Therefore, periodic examination for DR in older patients with diabetes is important for predicting renal function deterioration and CKD progression.
Introduction
Diabetic nephropathy and diabetic retinopathy (DR) are major microvascular complications of diabetes mellitus (DM) with a similar pathogenesis. They also share risk factors such as smoking, poorly controlled blood glucose levels, hypertension (HTN), and hyperlipidemia [1,2]. As a microvascular complication of type 1 DM, the correlation between DR and chronic kidney disease (CKD) has been well established; however, in type 2 DM, the correlation between these two conditions remains relatively unclear [3,4].
Meanwhile, with global increases in life expectancy and long-term exposure to metabolic risk factors, there has been a rapid increase in the prevalence of DM among older adults [5,6]. The global prevalence of type 2 DM in this population was reported to be approximately 22% in 2017 [5]. Korea is also an aging society, and a survey conducted from 2016 to 2018 reported a DM prevalence of approximately 28% among individuals aged >65 years, which is higher than the global average [7]. Furthermore, aging itself is associated with the pathogenesis of DM owing to a decrease in pancreatic beta cell function and impaired regulation of various hormones [8].
Despite the recent increasing trend in the prevalence of DM among older individuals, the relationship between DR and CKD in older patients with DM is still uncertain. A recent large cohort study indicated that the severity of DR is also related to CKD progression [9]. However, these large-scale studies were not conducted exclusively in older patients with DM. Therefore, to confirm the relationship between DR and CKD in this subpopulation, a follow-up analysis of older individuals in a large-scale study or additional studies tailored to those greater than a cutoff age are needed. The present study was conducted to investigate renal function and the proportion of advanced CKD cases with respect to the degree of DR in older patients with DM. The present study also examined whether there are additional factors influencing the relationship between advanced CKD and the degree of DR, and in particular, whether the degree of DR and proteinuria have an additive effect on advanced CKD.
Methods
Ethical statements: This study was approved by the Institutional Review Board (IRB) of Daegu Catholic University Hospital (IRB No: CR-22-022) with an exemption from informed consent. Personal data related to patient information were used and personally identifiable information was protected. This was a retrospective cross-sectional study that did not include personally identifiable information. All study methods were performed in compliance with relevant guidelines and regulations.
1. Study design
A total of 272 patients with DM and CKD stage ≥3 who visited both the nephrology and ophthalmology outpatient departments from July 2021 to January 2022 were screened. Patients with a follow-up period of fewer than 6 months and those who were not screened periodically were excluded. Patients aged <60 years and those with overt or past cancer, autosomal dominant polycystic kidney disease (ADPKD), or solid organ transplantation were also excluded. The World Health Organization has defined old age as ≥60 years [10]. In this study, an older patient was considered at least 60 years old; therefore, the inclusion and exclusion criteria for the study were established. Laboratory test results, such as those assessing renal function and albuminuria, were examined in all patients who met the inclusion criteria. Patients were also evaluated for DR by dilated fundus examination with wide-field fundus photography.
Basic patient information, including age, sex, insulin use, DM duration, HTN, hyperlipidemia, past cerebrovascular accident (CVA), and history of cardiovascular disease (CVD), was collected through an electronic chart review. CVD was clarified as myocardial infarction (MI), acute coronary syndrome (ACS), congestive heart failure (CHF), arrhythmia, or valvular heart disease (VHD). CVD history was diagnosed by a cardiologist. If echocardiography was performed within 6 months, relevant reports were reviewed. Data pertaining to creatinine (Cr), glycated hemoglobin (HbA1c), cholesterol, and serum albumin levels and random urine albumin-Cr ratio were collected from laboratory tests. Albuminuria included both microalbuminuria (30 mg/g Cr≤random urine albumin-Cr ratio<300 mg/g Cr) and macroalbuminuria (random urine albumin-Cr ratio of ≥300 mg/g Cr).
We compared renal function and the distribution of CKD stages according to the degree of DR. Cr levels and the estimated glomerular filtration rate (eGFR) were used to compare renal function. eGFR was calculated using the Chronic Kidney Disease Epidemiology Collaboration (CKD-EPI) equation [11]. CKD stage was defined according to the CKD Evaluation and Management criteria reported in 2012 in the Kidney Disease: Improving Global Outcomes (KDIGO) guidelines. Moreover, we investigated whether there were risk factors for advanced CKD, including the degree of DR. Advanced CKD was defined as CKD stages 4 and 5. To analyze the impact of DR on the prevalence of advanced CKD, we used several factors, such as very old age, male sex, poorly controlled DM, macroalbuminuria, insulin use, DM duration of ≥10 years, history of CVA, HTN, hyperlipidemia, CVD, MI, ACS, CHF, arrhythmia, and history of VHD. In previous research, including the 2018 European Society of Cardiology/European Society of Hypertension (ESC/ESH) blood pressure guidelines, age of ≥80 years was defined as very old, and we adopted this definition in our study [12]. Although the definition of poorly controlled DM differs among studies, we defined it as an HbA1c level of ≥8% in our study.
2. Fundus examination
Patients who visited the ophthalmology department underwent wide fundus photography and fundus examination after pupil dilation. Fluorescein angiography was performed on all patients suspected of having a new vessel in the fundus examination to distinguish proliferative DR (PDR) from severe nonproliferative DR (NPDR). No DR, NPDR, and PDR were classified according to the Early Treatment Diabetic Retinopathy Study severity scale, and all patients who had undergone panretinal photocoagulation or pars plana vitrectomy for treatment of PDR were included in the PDR group [13,14]. In this examination, even if one eye was normal and the contralateral eye was diagnosed with NPDR, the patient was included in the NPDR group. If only one eye was diagnosed with PDR, the patient was included in the PDR group.
3. Statistical analysis
The three groups classified according to the degree of DR were compared using independent two-sample t-tests or one-way analysis of variance (ANOVA) for continuous variables and chi-square or Fisher exact tests for nominal variables. Bonferroni and Tukey methods were used for post-hoc analysis of one-way ANOVA results. Receiver operating characteristic (ROC) curve analysis was used to confirm the cutoff value of renal function for NPDR or PDR. The cutoff value was defined as the value that maximized the sensitivity and specificity of the ROC curve (Youden index). The trend in the proportion of advanced CKD according to the degree of DR was analyzed using a linear-by-linear association. The forward conditional method and binary logistic regression analysis were used to select variables regarding risk factors to compare advanced CKD among the three groups. Very old age, male sex, poorly controlled DM, macroalbuminuria, insulin use, DM duration of ≥10 years, past CVA, HTN, hyperlipidemia, CVD, MI, ACS, CHF, arrhythmia, and history of VHD were considered confounding variables in the multivariate analysis. As mentioned in the introduction, these confounding factors are widely known risk factors for diabetic nephropathy [1,2]. In the next section, we present the results of multivariate binary logistic regression using the three models. CVD is a broad term for many diseases, including MI, ACS, CHF, arrhythmia, and VHD; when CVD was used for adjustment, the individual diseases were not considered confounding factors. Even when individual CVD diseases were used as confounding factors, regression analysis was not performed by selecting duplicates because MI is a subset of ACS. In addition, a hierarchical regression analysis was conducted using Baron and Kenny method for mediation to analyze the interaction between the degree of DR and level of proteinuria in advanced CKD [15]. The level of statistical significance was set at p<0.05. All statistical analyses were performed using IBM SPSS version 19.0 (IBM Corp., Armonk, NY, USA).
Results
1. Basic characteristics
Of the 272 patients, 33 who had a follow-up period of fewer than 6 months or for whom serial laboratory tests were not performed were excluded. Of the remaining 239 patients, 81 aged <60 years, 14 with cancer, three with ADPKD, 15 who received liver transplantation, and 10 who received kidney transplantation were excluded, and 116 patients were finally analyzed. Based on the degree of DR, these 116 patients were classified into the no DR group (53 patients), NPDR group (20 patients), and PDR group (43 patients) (Fig. 1).
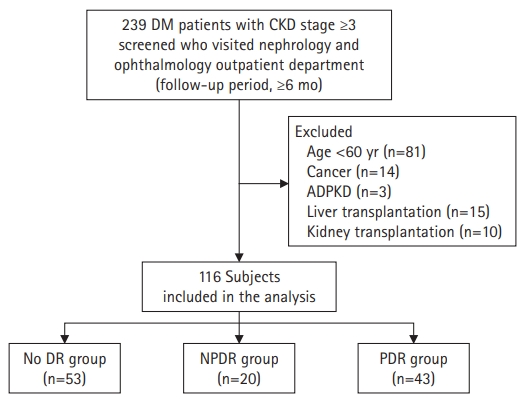
Distribution of patients included in this study. DM, diabetes mellitus; CKD, chronic kidney disease; ADPKD, autosomal dominant polycystic kidney disease; DR, diabetic retinopathy; NPDR, nonproliferative DR; PDR, proliferative DR.
The basic characteristics of the patients included in this study are summarized in Table 1. No significant difference was observed in age and sex among the three groups classified according to the degree of DR. A significant difference was detected in the serum albumin concentration between the no DR and PDR groups. However, the respective mean levels were 4.10 and 3.95 g/dL, which were higher than the standard hypoalbuminemia cutoff level of 3.5 g/dL. The prevalence of albuminuria was significantly higher in the PDR group than in the other two groups. In particular, the prevalence of macroalbuminuria was significantly higher in the PDR group than in the other two groups, whereas that of microalbuminuria was not statistically different. Insulin use was significantly higher in the NPDR and PDR groups than in the no DR group. The NPDR group showed the highest rate, but no significant difference was observed between the NPDR and PDR groups. The duration of DM was longer in the NPDR and PDR groups than in the no DR group, but the difference was significant only between the no DR and PDR groups. Past CVA incidence was significantly higher in the PDR group than in the no DR group.
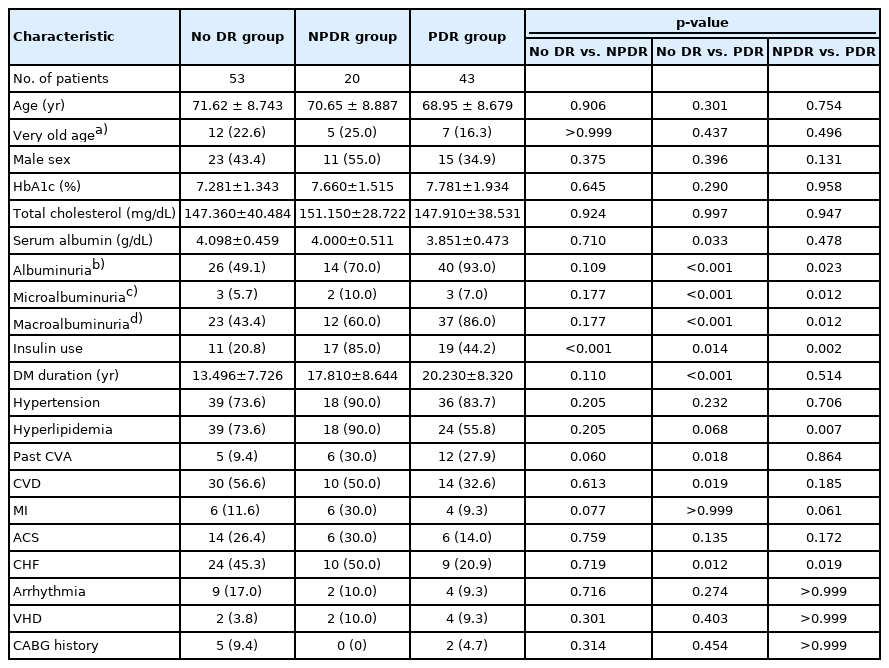
Basic characteristics of the three groups classified according to the degree of DR
2. Comparison of renal function according to degree of diabetic retinopathy
In the comparison of renal function among the three groups, the mean serum Cr level was 2.13 mg/dL in the no DR group, 3.19 mg/dL in the NPDR group, and 3.71 mg/dL in the PDR group. With the severity of DR, the mean serum Cr level tended to be higher, and it was significantly higher in the NPDR and PDR groups than in the no DR group. Among the three groups, the mean eGFR was 34.0 mL/min/1.73 m2 in the no DR group, 24.5 mL/min/1.73 m2 in the NPDR group, and 20.3 mL/min/1.73 m2 in the PDR group. Corresponding to the trend in serum Cr levels, the mean eGFR decreased with the severity of DR, and a significant difference was observed when comparing the NPDR and PDR groups to the no DR group. However, no significant difference was observed in the mean eGFR between the NPDR and PDR groups (Fig. 2).
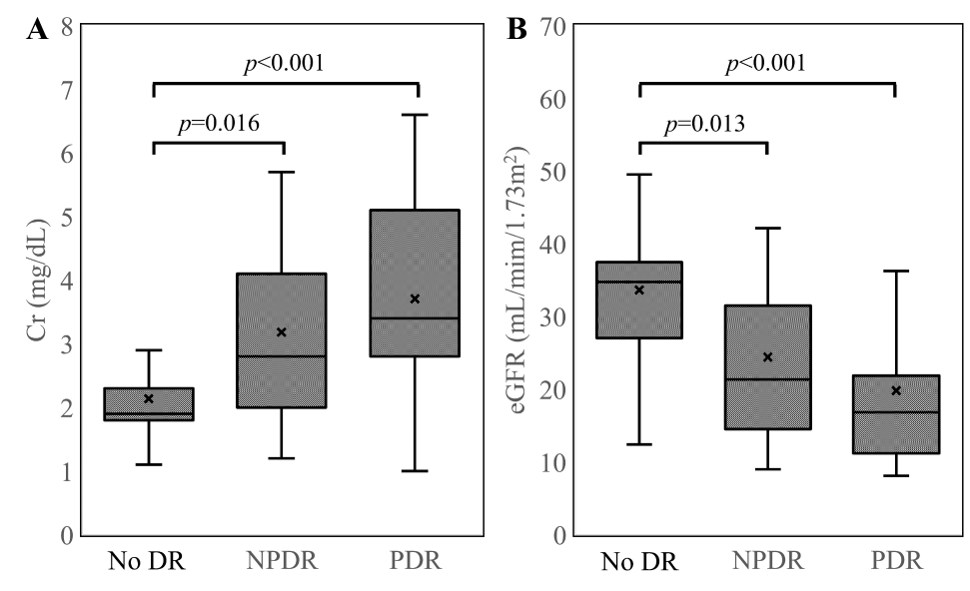
Comparison of renal function according to the degree of DR in older patients with type 2 diabetes mellitus. As the degree of DR progresses, the mean Cr level increases and the mean eGFR tends to decrease. However, in the post-hoc analysis, there is a significant difference only between the no DR and NPDR groups and between the no DR and PDR groups. Meanwhile, in the Spearman correlation analysis, Cr level and eGFR show positive and negative correlations with the degree of DR, respectively. (A) Comparison of Cr according to the degree of DR. (B) Comparison of eGFR according to the degree of DR. Cr, creatinine; eGFR, estimated glomerular filtration rate; DR, diabetic retinopathy; NPDR, nonproliferative DR; PDR, proliferative DR.
3. Cutoff value of renal function to predict comorbidities of nonproliferative and proliferative diabetic retinopathies
In the ROC curve analysis of renal function for NPDR, the area under the curve (AUC) was statistically significant at 0.732 for Cr level and 0.716 for eGFR (p=0.002 for Cr and p=0.005 for eGFR). The cutoff value of Cr and eGFR predicting NPDR were 2.25 mg/dL and 27.41 mL/min/1.73 m2, respectively, and the sensitivity and specificity for NPDR were 70.0% and 71.7%, respectively, at a Cr level of 2.25 mg/dL and 70.0% and 73.6%, respectively, at an eGFR of 27.41 mL/min/1.73 m2. In the ROC curve analysis of renal function for PDR, the AUC was 0.771 for Cr level and 0.769 for eGFR, and the cutoff values were 2.65 mg/dL and 21.27 mL/min/1.73 m2 for Cr and eGFR, respectively. The sensitivity and specificity for predicting PDR were 79.1% and 26.0%, respectively, at a Cr level of 2.65 mg/dL and 72.1% and 75.3%, respectively, at an eGFR of 21.27 mL/min/1.73 m2 (Fig. 3).

ROC curves of renal function for NPDR and PDR in older patients with type 2 diabetes mellitus (DM). The degree of renal function deterioration in older patients with type 2 DM may be helpful in predicting the presence of NPDR or PDR. (A) ROC curve of Cr level for NPDR. (B) ROC curve of eGFR for NPDR. (C) ROC curve of Cr level for PDR. (D) ROC curve of eGFR for PDR. AUC, area under the curve; CI, confidence interval; ROC, receiver operating characteristic; Cr, creatinine; eGFR, estimated glomerular filtration rate; NPDR, nonproliferative diabetic retinopathy; PDR, proliferative diabetic retinopathy.
4. Comparison of the distribution of chronic kidney disease stages and proportion of advanced chronic kidney disease cases
Regarding the distribution of CKD stages ≥3 in the no DR group, 64.2%, 30.2%, and 5.7% of patients were categorized as stages 3, 4, and 5, respectively, with the proportions being statistically significantly different between CKD stages 3 and 5. The distribution of CKD stages in the PDR group was as follows: CKD stage 3, 14.0%; CKD stage 4, 44.2%; and CKD stage 5, 41.8%. A statistically significant difference was detected between CKD stages 3 and 5 in the PDR group, as observed in the no DR group. When the trend in the proportion of advanced CKD was analyzed according to DR severity via linear-by-linear association, the proportion of advanced CKD was found to significantly increase with the severity of DR (p for trend <0.001) (Fig. 4).
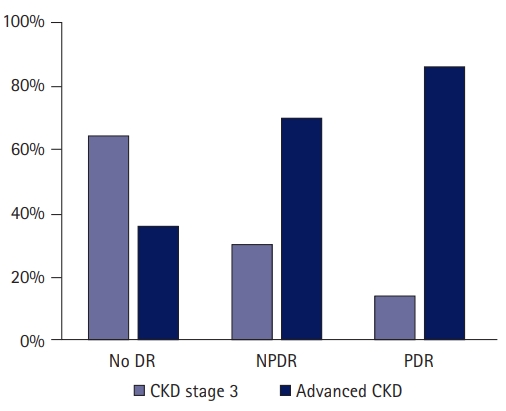
Comparison of advanced CKD proportion according to the degree of DR among older patients with type 2 diabetes mellitus (DM) and CKD stage ≥3. The proportion of advanced CKD cases among older patients with type 2 DM and CKD stage >3 increases significantly with the severity of DR. DR, diabetic retinopathy; NPDR, nonproliferative DR; PDR, proliferative DR; CKD, chronic kidney disease.
5. Association between diabetic retinopathy degree and proportion of advanced chronic kidney disease
In the univariate binary logistic regression analysis, the proportion of patients with CKD stage ≥3 having advanced CKD was approximately 4.2 times higher in the NPDR group and approximately 11.0 times higher in the PDR group than in the no DR group, and both differences were statistically significant. Moreover, in the same analysis, the odds ratio for the advanced CKD proportion was approximately 4.4 for macroalbuminuria, 5.5 for DM duration of ≥10 years, 3.0 for HTN, 5.5 for MI, and 2.3 for CHF. These results were found to be statistically significant. The results of the univariate binary logistic regression analysis of the proportion of patients with advanced CKD are summarized in Table 2.
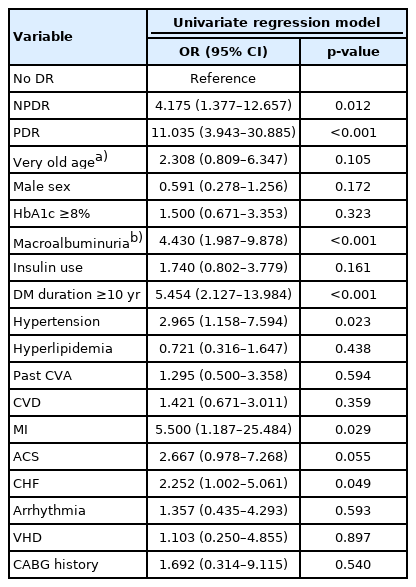
Univariate binary logistic regression analysis of advanced chronic kidney disease
Even in the multivariate binary logistic regression analysis, the odds ratio for advanced CKD proportion was higher than that in the no DR group as the degree of DR progressed, even after adjusting for various factors. Multivariate regression model 1 was adjusted for the following factors: very old age, male sex, poorly controlled DM, macroalbuminuria, insulin use, DM duration of ≥10 years, past CVA, HTN, hyperlipidemia, and history of CVD. The odds ratio compared with the no PDR group was approximately 4.6 for the NPDR group and approximately 11.8 for the PDR group, and both differences were statistically significant. Next, multivariate regression model 2 was adjusted for the following factors: old age, male sex, poorly controlled DM, macroproteinuria, insulin use, DM duration of ≥10 years, past CVA, HTN, hyperlipidemia, MI, CHF, arrhythmia, and history of VHD. The odds ratio compared with the no PDR group was approximately 9.4 for the NPDR group and approximately 25.7 for the PDR group, and both differences were statistically significant. Finally, multivariate regression model 3 was adjusted for the following factors: old age, male sex, poorly controlled DM, macroproteinuria, insulin use, DM duration of ≥10 years, past CVA, HTN, hyperlipidemia, ACS, CHF, arrhythmia, and history of VHD. The odds ratio compared with the no PDR group was approximately 5.5 for the NPDR group and approximately 20.2 for the PDR group, and both differences were statistically significant. The results of the multivariate binary logistic regression analysis of the proportion of patients with advanced CKD are summarized in Table 3.

Multivariate binary logistic regression analysis of advanced chronic kidney disease
Discussion
Previous studies have documented that the natural course of diabetic nephropathy in most cases of type 1 DM is consistent and typical [16-20]. In type 1 DM that is not appropriately treated, microalbuminuria commonly appears 10 to 15 years after disease onset and overt proteinuria appears 20 years after disease onset, resulting in a decrease in glomerular filtration rate [16]. Furthermore, the natural course of DR in type 1 DM occurs in approximately half of patients 7 years after disease onset. It has also been reported that DR precedes diabetic nephropathy in most cases [21,22].
In contrast, in type 2 DM, the natural course of diabetic nephropathy is atypical and inconsistent; therefore, it is common to have a varied range of proteinuria at the time of diagnosis [17,23]. Moreover, it is controversial whether DR precedes diabetic nephropathy in type 2 DM, and in some reports, diabetic nephropathy was confirmed by renal biopsy, even in the absence of DR [24,25]. In previous large cohort studies, the overall prevalence of diabetic nephropathy in patients with type 2 DM was reported to be approximately 17% to 58% [26,27]. In particular, a multinational multicenter cohort study indicated that the prevalence of diabetic nephropathy in patients with type 2 DM tended to be higher in Asia than in Europe, and in Korea, it was 58%, the highest prevalence in Asia [27]. Furthermore, it is important to consider the significantly higher prevalence of type 2 DM than type 1 DM [5,28]. The Diabetes Prevalence Trend Report indicated that the global prevalence of DM is expected to increase from 8.4% in 2017 to 9.9% in 2045, with the prevalence of DM in older individuals reaching almost 20% as of 2017 [29]. Therefore, we focused on the correlations between various microvascular complications in older patients with type 2 DM.
In addition, studies have established that DR and diabetic nephropathy can act as risk factors for each other in patients with type 1 DM [3,18,30]. Relatively few studies have investigated the relationship between DR and diabetic nephropathy in type 2 DM, but there have been reports that the mutual effect of DR and diabetic nephropathy is small compared with that in type 1 DM [3,31,32]. El-Asrar et al. [32] reported that the risk of diabetic nephropathy was higher in patients with type 2 DM according to the severity of DR, but lower than the increased risk in patients with type 1 DM. Parving et al. [31] also reported that the rate of DR was higher in patients with overt proteinuria than in patients without proteinuria. In our study, the degree of DR was associated with deterioration of renal function in older patients with type 2 DM and CKD stage ≥3. Moreover, the proportion of patients with advanced CKD was significantly higher when the degree of DR was higher. These results are consistent with those of previous studies. Nevertheless, previous studies did not target older individuals exclusively or they set the exclusion criterion for age to ≥66 years; therefore, these studies cannot explain the relationship between DR and diabetic nephropathy in older patients with type 2 DM. Our study was different from these previous studies, as we targeted older patients with type 2 DM aged ≥60 years.
Meanwhile, by analyzing 1,583 patients with CKD in the Chronic Renal Insufficiency Cohort (CRIC) Study, Grunwald et al. [9] reported that exacerbation of retinopathy was related to the severity of CKD. However, in their study, the mean age was 60 years, and there were 680 patients with DM (43.0%). Moreover, when only the patients with DM were analyzed, the exacerbation of retinopathy did not significantly affect CKD severity [9]. Although these results are inconsistent with our results, it may be essential to consider the age difference of subjects between the two studies and that their study included patients without DM. Hence, there is a need for larger, well-designed studies investigating the relationship between DR and CKD in older patients with type 2 DM in the future.
Finally, in the univariate regression analysis, we found that the degree of DR in older patients with type 2 DM was associated with a high proportion of advanced CKD cases. Interestingly, these effects were consistent even after adjusting for various factors such as very old age, sex, poorly controlled DM, macroalbuminuria, insulin use, DM duration of ≥10 years, and various underlying diseases such as past CVA, HTN, hyperlipidemia, and CVD. These are widely reported risk factors for diabetic nephropathy in several previous studies [1,2,33]. Our results suggest that DR is associated with a higher rate of advanced CKD as well as well-known risk factors in older patients with type 2 DM. It has been reported that the relationship between DR and diabetic nephropathy in patients with insulin-treated type 2 DM was similar to that in patients with type 1 DM [34,35]. Among our study participants, the rate of insulin use was 40.5%, and a higher insulin-use rate in patients with DR or advanced CKD might have affected the results of this study.
Recently, retinal vessels have been identified noninvasively in the ophthalmic field using optical coherence tomography angiography (OCTA). Studies have confirmed the relationship between retinal microvascular changes in DR and diabetic nephropathy. Cankurtaran et al. [36] reported that vessel densities in the superficial capillary plexus, whole disc, and peripapillary area were significantly different depending on the presence of diabetic albuminuria, even in the absence of DR. In other studies, patients with either type 1 or type 2 DM showed a decrease in the quantitative parameters identified by OCTA in diabetic nephropathy [37,38]. Although our study did not evaluate OCTA quantitative parameters and simply confirmed the relationship between DR severity and diabetic nephropathy, meaningful results can be expected if such OCTA parameters are used in the analysis in future studies.
This study has several limitations. First, a selection bias may have occurred. Since the participants were patients who presented at both the nephrology and ophthalmology departments at a tertiary medical institution, the basic characteristics of older patients with type 2 DM in the real world may be different, and there may be differences in treatment adherence. Second, owing to the retrospective cross-sectional study design, changes over time were not reflected. In particular, the rate of severity of DR or CKD can vary among people; therefore, even if they are classified in the same category cross-sectionally, their prognosis may vary over time. Therefore, retrospective or prospective longitudinal observational studies are required to evaluate follow-up changes. Third, this was a small-scale, single-institution study, and the results must be interpreted carefully considering the basic characteristics of the study.
In conclusion, the severity of DR in older patients with type 2 DM may be associated with deterioration of renal function and a higher proportion of advanced CKD. However, this study was small, and it is difficult to clearly elucidate the relationship between DR and CKD in older patients with DM. Therefore, larger, well-designed, longitudinal studies are needed in the future. Nevertheless, ophthalmology and renal function follow-up tests may be underestimated due to reduced mobility or lack of independence in older individuals; therefore, attention may be required to address this potential shortcoming.
Notes
Conflicts of interest
No potential conflict of interest relevant to this article was reported.
Funding
None.
Author contributions
Conceptualization, Methodology, Investigation: all authors; Data curation, Formal analysis, Project administration, Visualization, Resources, Software, Supervision, Validation: GWL, SGK; Writing-original draft: GWL, SGK; Writing-review & editing: GWL, SGK.