E-Submission
PubMed Central, CAS, DOAJ, KCI

Articles
- Page Path
- HOME > J Yeungnam Med Sci > Volume 36(2); 2019 > Article
-
Original article
Association between cadmium exposure and hearing impairment: a population-based study in Korean adults -
Da Jung Jung

-
Yeungnam University Journal of Medicine 2019;36(2):141-147.
DOI: https://doi.org/10.12701/yujm.2019.00178
Published online: April 15, 2019
Department of Otorhinolaryngology-Head and Neck Surgery, Kyungpook National University School of Medicine, Daegu, Korea
- Corresponding author: Da Jung Jung, Department of Otorhinolaryngology-Head and Neck Surgery, Kyungpook National University School of Medicine, 130, Dongdeok-ro, Jung-gu, Daegu 41944, Korea Tel: +82-53-420-5777, Fax: +82-53-423-4524, E-mail: wjddk0731@naver.com
Copyright © 2019 Yeungnam University College of Medicine
This is an Open Access article distributed under the terms of the Creative Commons Attribution Non-Commercial License (http://creativecommons.org/licenses/by-nc/4.0/) which permits unrestricted non-commercial use, distribution, and reproduction in any medium, provided the original work is properly cited.
- 5,123 Views
- 78 Download
- 2 Crossref
Abstract
-
Background
- The present study aimed to evaluate the clinical association between cadmium exposure and hearing impairment among the Korean population.
-
Methods
- This retrospective cross-sectional study used the data obtained from the Korean National Health and Nutrition Examination Survey were used for our study. Finally, 3,228 participants were included in our study, which were then divided into quartiles based on their blood cadmium levels: first quartile (1Q), second quartile (2Q), third quartile (3Q), and fourth quartile (4Q) groups. The hearing thresholds were measured using an automatic audiometer at 0.5, 1, 2, 3, 4, and 6 kHz. Hearing loss (HL) was defined as >25 dB average hearing threshold (AHT).
-
Results
- All the groups had 807 participants each. The area under the receiver operating characteristic curves of cadmium level for HL were 0.634 (95% confidence interval [CI], 0.621–0.646). The participants in the 4Q group had higher Low/Mid-Freq, High-Freq, and AHT values than those in the other groups in the multivariate analysis after adjusting for confounding factors. The logistic regression showed that the OR for HL per 1 µg/L increase in cadmium was 1.25 (95% CI, 1.09–1.44; p=0.002) on the multivariate analysis. Moreover, the multivariate logistic regression analyses revealed that the participants in the 4Q group exhibited a 1.59-, 1.38-, and 1.41-fold higher odds for HL than those in the 1Q, 2Q, and 3Q groups, respectively.
-
Conclusion
- High cadmium level quartile was associated with increased hearing thresholds and HL among the Korean adult population.
- Hearing loss (HL) is one of the health problems with the highest prevalence. The World Health Organization (WHO) showed that 360 million individuals are suffering from HL, with its health-care cost amounting to approximately $750 billion globally [1]. HL is associated with decreased quality of life and social communication. Therefore, early detection of HL and identification of its risk factors are important health issues worldwide. Environmental or industrial exposure to various heavy metals is an essential cause of hearing impairment among the general population.
- Cadmium is a toxic, nonessential transition metal, and its accumulation in the body is associated with cancer or neurotoxicity development [2]. Many studies have shown that cadmium causes ototoxicity through various mechanisms. An animal study revealed that cadmium-exposed rat developed abnormalities in the auditory brainstem response waves, and changes in the ionic composition of the inner ear perilymph were observed [3]. Kim et al. showed that cadmium causes reactive oxygen species generation in the cochlear cells, which results in increased hearing thresholds [4]. In contrast to many in vitro or in vivo studies, population-based studies regarding the association between cadmium exposure and hearing impairment are sparse. Choi et al. investigated 3,698 American adults who were randomly assigned to the Audiometry Examination Component of the National Health and Nutrition Examination Survey (NHANES), and their results showed a positive association between cadmium exposure and hearing impairment [5]. Shiue used a data set from a different period in the same survey, but they did not find an association between cadmium exposure and HL [6]. Except for the previous two studies, few studies on the association between cadmium exposure and HL among the adult populations are available. Therefore, further research is needed to identify the relationship between the two. The present study aimed to evaluate the clinical association between cadmium exposure and hearing impairment among the Korean population.
Introduction
- 1. Study population
- This retrospective cross-sectional study used the data obtained from the 2010–2012 Korean National Health and Nutrition Examination Survey (KNHANES) were used for our study. The KNHANES is a nationwide, multi-stage, stratified survey of a representative sample of the South Korean population conducted by the Korea Centers for Disease Control and Prevention. A total of 10,787 participants aged between 40 and 70 years. Among them, 1,351 and 6,209 participants whose data on hearing thresholds and cadmium levels, respectively, were unavailable were excluded from the study. Finally, 3,228 participants were included in our study, which were then divided into quartiles based on their blood cadmium levels: first quartile (1Q), second quartile (2Q), third quartile (3Q), and fourth quartile (4Q) groups. Kyungpook National University Hospital Institutional Review Board approval was obtained for our study (KNUH 2018-11-009).
- 2. Study variables
- The following clinical and laboratory data were collected from the participants during the health examination: cadmium level, lead level, age, sex, presence of diabetes mellitus (DM), presence of hypertension (HTN), smoking habit, alcohol intake, explosive and occupational noise exposure, and hearing thresholds.
- DM was defined as a self-reported history of a DM diagnosis, use of hypoglycemic drugs, ≥126 mg/dL fasting glucose level, or ≥6.5% HbA1c. HTN was defined as ≥140 mmHg systolic blood pressure, ≥90 mmHg diastolic blood pressure, self-reported history of HTN, or use of anti-hypertensive drugs. The participants were classified based on their smoking status as either current smokers (consumed ≥100 cigarettes in their lifetime and ceased smoking <1 year before the survey), ex-smokers (consumed ≥100 cigarettes in their lifetime and ceased smoking ≥1 year before the survey), or non-smokers (consumed <100 cigarettes in their lifetime). Alcohol intake was defined using the Korean version of standard drinking, which is based on the WHO classification system [7]. We classified the alcohol intake into the following categories: abstinence (no alcohol consumption during the 12 months prior to the evaluation), moderate consumption (women, 0.1–19.99 g pure alcohol/day; men, 0.1–39.99 g pure alcohol/day), and heavy consumption (women, ≥20 g pure alcohol/day; men, ≥40 g pure alcohol/day).
- Histories of exposure to explosive and occupational noise were classified as positive or negative, as previously described [8]. An explosive noise was defined as a sudden loud noise, such as an explosion or gunshot. Exposure to occupational noise was positive if participants had worked in a location with loud machinery for ≥3 months. Additionally, exposure to loud noise was positive if participants needed to raise their voice to have a conversation. The hearing thresholds were measured using an automatic audiometer at 0.5, 1, 2, 3, 4, and 6 kHz. For both ears of each subject, the threshold values at 0.5, 1, and 2 kHz were averaged to obtain the low- or middle-frequency pure-tone average (Low/Mid-Freq), and the values at 3, 4, and 6 kHz were averaged to obtain the high-frequency pure-tone average (High-Freq). The average hearing threshold (AHT) was calculated as the pure-tone average of the thresholds at 0.5, 1, 2, and 3 kHz. HL was defined as >25 dB AHT.
- The cadmium levels in the blood were measured using graphite furnace atomic absorption spectrometry (Analyst 600; PerkinElmer, Turku, Finland) and presented as µg/L. All blood cadmium analyses were performed by the Neodin Medical Institute, a laboratory certified by the Ministry of Health and Welfare of Korea. The internal quality assurance and control was conducted 4 times every month using four commercial reference materials (Lyphochek Whole Blood Metals Control; Bio-Rad Laboratories, Hercules, CA, USA) with different concentrations, and most of the results were within the allowable range. The coefficients of the blood cadmium variations were within 0.95–4.82% in the reference samples. The external quality assurance and control was performed 4 times every year; the institute passed both the German External Quality Assessment Scheme and Quality Assurance Program operated by Friedrich-Alexander University and Korea Occupational Safety and Health Agency, respectively [9].
- Statistical analyses
- The data were analyzed using the IBM SPSS version 19 (IBM Co., Armonk, NY, USA). The categorical and continuous variables were expressed as counts (%) and means±standard error (SE) or standard deviation, respectively. Pearson’s χ2 or Fisher’s exact test was used to analyze the categorical variables. Meanwhile, the means of the continuous variables were compared using one-way analysis of covariance, followed by a post-hoc Tukey’s comparison. We calculated the sensitivity, specificity, cutoff values, and probability of the area under the receiver operating characteristic curve (AUROC) to predict the HL using cadmium level. The strength of the relationship between the continuous variables was assessed using correlation coefficients. A linear regression analysis was performed to examine the independent predictors of the hearing thresholds. Logistic regression analyses were used to estimate the odds ratios (ORs) and 95% confidence intervals (CIs), which were then utilized to determine the correlation between cadmium level and HL. Model 1 were adjusted for age, sex, presence of DM and HTN, smoking habit, alcohol intake, and explosive or occupational noise exposure. Model 2 were adjusted for variables for Model 1 and lead level. The multivariate analyses were performed using analysis of covariance and linear or logistic regression analysis. p-values <0.05 were considered statistically significant.
Materials and methods
- 1. Participants’ clinical characteristics
- All the groups had 807 participants each (Table 1). The mean cadmium values (interval) in the 1Q, 2Q, 3Q, and 4Q groups were 0.67 (0.10–0.87), 1.05 (0.86–1.21), 1.41 (1.22–1.65), and 2.25 (1.66–6.42) µg/L, respectively. The participants in the 1Q group had lower mean age than those of the other groups. Meanwhile, the 4Q group displayed higher proportions of participants who had HTN, current smoking habits, and heavy alcohol intake than the other groups. Furthermore, the 1Q group had higher proportion of participants who were exposure to explosive noise than the other groups. The mean lead values in the 1Q, 2Q, 3Q, and 4Q groups were 2.41±1.23, 2.54±1.10, 2.69±1.43, and 2.81±1.41 µg/dL, respectively (p<0.001).
- 2. Association between cadmium level and hearing impairment
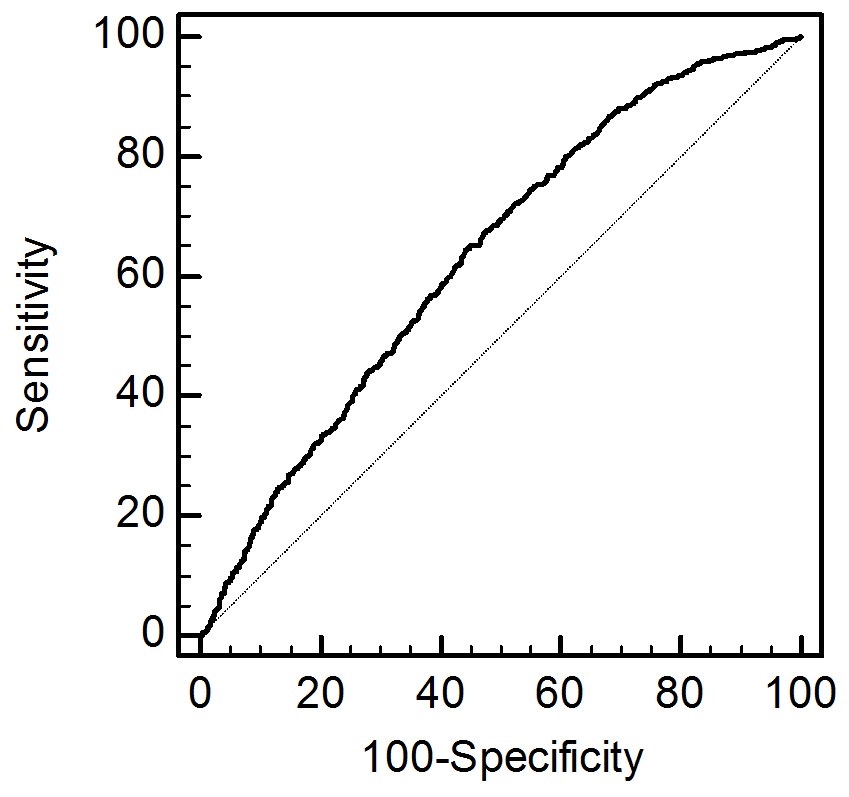
- The AUROCs of cadmium level for HL were 0.634 (95% CI, 0.621–0.646; Fig. 1). The sensitivity and specificity for predicting HL were 64.8% (95% CI, 61.4–68.0) and 55.5% (95% CI, 54.1–56.9), respectively (p<0.001).
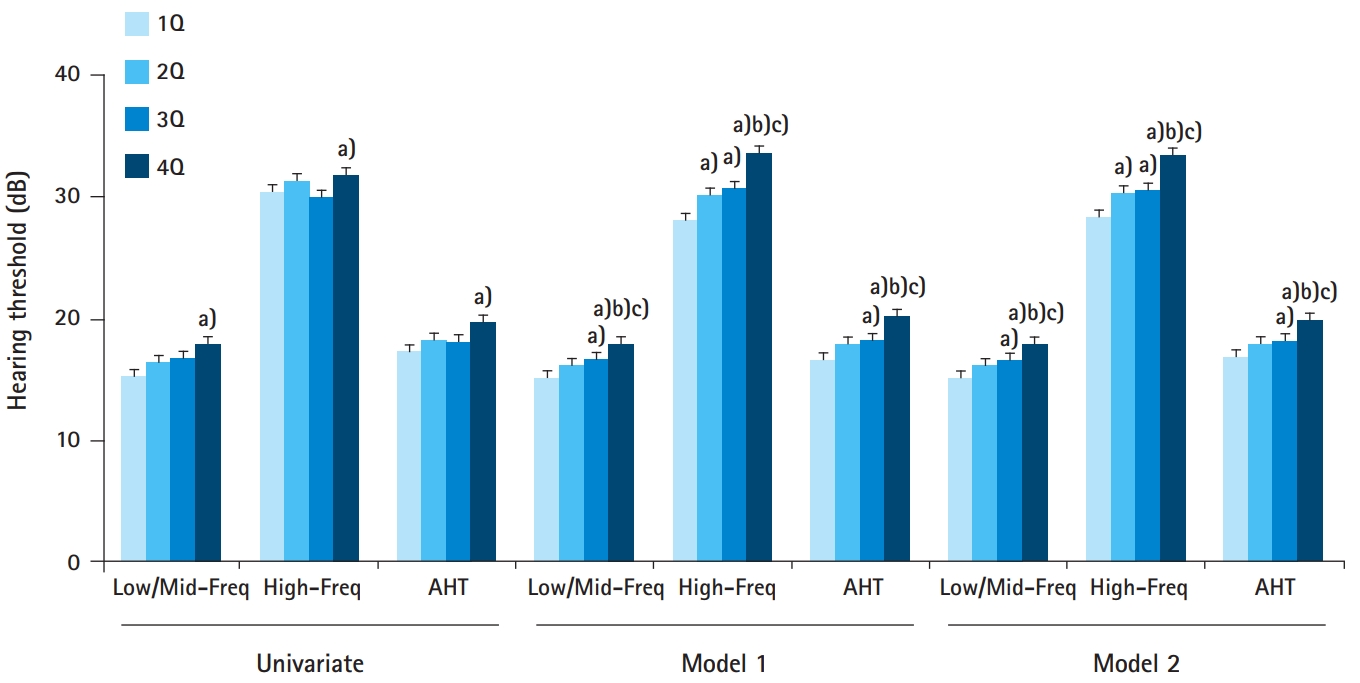
- In the univariate analysis, participants in the 4Q group showed higher Low/Mid-Freq, High-Freq, and AHT values than those in 1Q group (Fig. 2). Similarly, the participants in the 4Q group had higher Low/Mid-Freq, High-Freq, and AHT values than those in the other groups in the multivariate analysis after adjusting for confounding factors. The numbers of participants with HL in the 1Q, 2Q, 3Q, and 4Q groups were 153 (19.0%), 169 (20.9%), 163 (20.2%), and 202 (25.1%), respectively (p=0.018). The logistic regression showed that the OR for HL per 1 µg/L increase in cadmium was 1.17 (95% CI, 1.04–1.32; p<0.001), 1.27 (95% CI, 1.11–1.46; p=0.001), and 1.25 (95% CI, 1.09-1.44; p=0.002) on the univariate, model 1, and 2 analyses, respectively. Moreover, the model 2 logistic regression analyses revealed that the participants in the 4Q group exhibited a 1.59-, 1.38-, and 1.41-fold higher odds for HL than those in the 1Q, 2Q, and 3Q groups, respectively (Table 2).
- The correlation coefficients of cadmium levels were 0.062, 0.016, and 0.054 for Low/Mid-Freq, High-Freq, and AHT, respectively (p<0.001 for Low/Mid-Freq, p=0.357 for High-Freq, and p=0.002 for AHT). The partial correlation coefficients of cadmium levels after adjusting for covariates of model 2 were 0.062, 0.085, and 0.072 for Low/Mid-Freq, High-Freq, and AHT, respectively (p<0.001 for all three thresholds). Additionally, the linear regression revealed that the unstandardized β±SE for cadmium level were 0.054±0.360, 0.083±0.363, and 0.074±0.367 on the univariate, model 1, and 2 analyses, respectively (Table 3). Positive associations between cadmium levels and AHT values were found.
Results
- Our study showed that the 4Q group had the highest values for all the three hearing thresholds (Low/Mid-Freq, High-Freq, and AHT) among the four groups. The multivariate analyses showed that increased cadmium level was associated with increased odds for HL. Furthermore, the participants from the 4Q group had higher odds for HL than those in the other groups. The cadmium level as a continuous variable was positively correlated with AHT on both univariate and multivariate analyses. Moreover, the linear regression analyses also revealed similar trends.
- Cadmium is a well-known environmental or industrial toxin, and an individual comes in contact with this substance through dietary intake, smoking, or polluted air inhalation [10]. Previous studies have shown the possible pathophysiologies of cadmium-induced hearing impairment using in vitro and in vivo models, which suggested that cadmium induced damage to various cells, including hair cells, spiral ganglion neurons, and auditory neurons [2,4,11]. To the best of our knowledge, five studies on the association between cadmium level and hearing impairment among the general population were published. However, these studies involved inhomogeneous study population and reported inconsistent results.
- Thatcher et al. first investigated the association between cadmium level and HL [12]. They evaluated the cadmium level in the hair and showed that it was associated with impaired auditory evoked potential. However, they did not assess the hearing thresholds and only enrolled children aged 5–16 years old. Shargorodsky et al. were the second to investigate the association between cadmium level and hearing impairment [13]. They used representative data (NHANES) and enrolled adolescents aged 12–19 years old. Furthermore, they evaluated the cadmium level of the participants’ urinary samples. Their results showed that participants in the highest urinary cadmium level quartile had higher odds for low-frequency HL than those in the lowest quartile. Additionally, their finding revealed the absence of statistical significance between cadmium level and high-frequency HL. Two more recent studies were conducted which involved the adult population [5,6]. Choi et al. also used representative data (NHANES) and enrolled adults aged 20–60 years old to evaluate the relationship between blood cadmium level and hearing thresholds [5]. Their results revealed statistically significant HL only between the lowest and highest quintile groups. Shiue utilized the same data (2003–2004 NHANES) and enrolled adults aged ≥50 years old [6]. They evaluated the cadmium level through the participants’ urinary samples, whereas the degree of hearing impairment was determined using a questionnaire (good, little trouble, or poor). Their findings showed the absence of an association between cadmium level and hearing impairment. All the aforementioned studies revealed conflicting results on the association between the two variables, and half of them enrolled only children. Additionally, all studies were conducted among the US populations.
- We used representative data from KNHANES and enrolled Korean adult population. We divided the hearing thresholds into three groups: Low/Mid-Freq, High-Freq, and AHT. Furthermore, we defined HL as a dependent variable and performed adjustments for potentially important confounding factors. Our results revealed that the participants in the highest cadmium level quartile had higher thresholds of or odds for HL than those in the other groups. Our study was the first study to evaluate the association between cadmium level and hearing impairment among the Asian population.
- Cadmium is a well-known heavy metal. Participants who exposed a heavy metal may be associated with exposure to other heavy metal. Our data showed that participants with high exposure of cadmium are associated with high lead levels. Therefore, we performed multivariate analyses with lead level as a covariate. Multivariate analyses showed that cadmium level is associated with hearing impairment irrelevant to lead exposure. In addition, a previous study evaluated the association between two heavy metal and hearing impairment using similar cohort [14]. However, they did not show a positive association between cadmium and hearing impairment. Different results from similar cohort may be associated with participants’ characteristics. Previous study enrolled participants aged 20 and older, but our study enrolled participants aged 40-70. Young population or extreme elderly population can lead to bias to evaluate the two variables. Young population had extremely low prevalence of hearing impairment. Elderly population is associated with extreme high prevalence of hearing impairment and hearing impairment may be more strongly associated with other factors such as drugs, neural degeneration, or noise.
- This study had several limitations to consider when interpreting the results. First, our study had a retrospective, cross-sectional design. Hence, we could not evaluate the causality between cadmium level and hearing impairment. Second, a selection bias might have been present in this study due to the exclusion of 7,560 people whose data on hearing thresholds or cadmium levels were not available. These individuals represent approximately 70.0% of the population aged 40–70 years. Third, cadmium levels were measured from blood samples and evaluated using a single measurement. The cadmium amount varies based on the recency of exposure [10]. Additionally, measuring the cadmium amount from urinary samples is a more precise method of predicting the actual cadmium level than that from blood samples. A prospective study that focuses on determining the urinary cadmium level is warranted to overcome these limitations.
- In conclusion, high cadmium level quartile was associated with increased hearing thresholds and HL among the Korean adult population. Therefore, early identification of high cadmium levels and providing appropriate interventions may be helpful to reduce or prevent hearing impairment.
Discussion
-
Acknowledgements
- This work was supported by the National Research Foundation of Korea (NRF) Grant funded by the Korea government(MSIT) (No. 2018R1C1B6007775).

| Variable | 1Q (n=807) | 2Q (n=807) | 3Q (n=807) | 4Q (n=807) | p-value |
|---|---|---|---|---|---|
| Age (yr) | 52.7±9.0 | 54.2±8.7a) | 55.0±8.5a) | 54.8±8.2a) | <0.001 |
| Sex (men, %) | 549 (68.0) | 431 (53.4) | 338 (41.9) | 292 (36.2) | <0.001 |
| Diabetes mellitus | 123 (15.2) | 109 (13.5) | 103 (12.8) | 104 (12.9) | 0.445 |
| Hypertension | 282 (35.0) | 303 (37.5) | 316 (39.2) | 344 (42.7) | 0.014 |
| Smoking habit | <0.001 | ||||
| Nonsmoker | 400 (50.3) | 427 (53.8) | 466 (58.2) | 465 (58.3) | |
| Ex-smoker | 295 (37.1) | 216 (27.2) | 136 (17.0) | 83 (10.4) | |
| Current smoker | 101 (12.7) | 150 (18.9) | 199 (24.8) | 250 (31.3) | |
| Alcohol intake | 0.005 | ||||
| Abstinence | 179 (22.6) | 211 (26.7) | 209 (26.2) | 233 (29.2) | |
| Moderate alcohol | 580 (73.2) | 540 (68.3) | 542 (67.8) | 508 (63.7) | |
| Heavy alcohol | 33 (4.2) | 40 (5.1) | 48 (6.0) | 56 (7.0) | |
| Exposure to occupational noise | 28 (3.5) | 42 (5.2) | 36 (4.5) | 48 (6.0) | 0.087 |
| Exposure to explosive noise | 70 (8.7) | 61 (7.6) | 53 (6.6) | 57 (7.1) | 0.032 |
The data were expressed as number (%) and mean±standard deviations for categorical and continuous variables, respectively.
1Q, first quartile; 2Q, second quartile; 3Q, third quartile; 4Q, fourth quartile.
p-values were tested using one-way analysis of variance, followed by a post-hoc Tukey’s comparison for continuous variables and Pearson’s χ2 or Fisher’s exact tests for categorical variables.
a) p<0.05 vs. 1Q.
|
Univariate |
Model 1a) |
Model 2a) |
||||
|---|---|---|---|---|---|---|
| OR (95% CI) | p-value | OR (95% CI) | p-value | OR (95% CI) | p-value | |
| Per 1 µg/L increase in cadmium | 1.17 (1.04–1.32) | 0.011 | 1.27 (1.11–1.46) | 0.001 | 1.25 (1.09–1.44) | 0.002 |
| 1Q | ||||||
| vs. 2Q | 1.13 (0.89–1.45) | 0.319 | 1.15 (0.89–1.50) | 0.285 | 1.14 (0.88–1.48) | 0.332 |
| vs. 3Q | 1.08 (0.85–1.38) | 0.531 | 1.15 (0.88–1.51) | 0.309 | 1.12 (0.85–1.48) | 0.416 |
| vs. 4Q | 1.43 (1.13–1.81) | 0.003 | 1.65 (1.25–2.17) | <0.001 | 1.59 (1.21–2.09) | 0.001 |
| 2Q | ||||||
| vs. 3Q | 0.71 (0.96–1.22) | 0.715 | 0.99 (0.76–1.28) | 0.919 | 0.98 (0.75–1.26) | 0.976 |
| vs. 4Q | 1.26 (1.00–1.59) | 0.049 | 1.40 (1.09–1.81) | 0.010 | 1.38 (1.06–1.78) | 0.015 |
| 3Q | ||||||
| vs. 4Q | 1.32 (1.05–1.67) | 0.020 | 1.43 (1.11–1.83) | 0.005 | 1.41 (1.10–1.81) | 0.007 |
OR, odds ratio; CI, confidence interval; 1Q, first quartile; vs, versus; 2Q, second quartile; 3Q, third quartile; 4Q, fourth quartile.
a) Model 1 for hearing loss was adjusted for age, sex, presence of diabetes mellitus and hypertension, smoking habit, alcohol intake, and occupational and explosive noise exposure. Model 2 for hearing loss was adjusted for age, sex, presence of diabetes mellitus and hypertension, smoking habit, alcohol intake, occupational and explosive noise exposure, and lead level.
| Independent variable |
Univariate |
Model 1 |
Model 2 |
||||
|---|---|---|---|---|---|---|---|
| US-β±SE | p-valuea) | US-β±SE | p-valuea) | US-β±SE | p-valuea) | ||
| Cadmium | 0.054±0.360 | 0.002 | 0.083±0.363 | <0.001 | 0.074±0.367 | <0.001 | |
| Age | 0.305±0.642 | <0.001 | 0.274±0.654 | <0.001 | 0.271±0.654 | <0.001 | |
| Sex | 0.079±0.481 | <0.001 | –0.113±0.683 | <0.001 | –0.096±0.696 | <0.001 | |
| Diabetes mellitus | 0.102±0.700 | <0.001 | 0.037±0.677 | 0.030 | 0.040±0.677 | 0.020 | |
| Hypertension | 0.162±0.487 | <0.001 | 0.092±0.482 | <0.001 | 0.091±0.481 | <0.001 | |
| Smoking habit | 0.048±0.294 | 0.007 | –0.010±0.405 | 0.694 | –0.013±0.405 | 0.580 | |
| Alcohol intake | –0.052±0.457 | 0.003 | –0.040±0.461 | 0.026 | –0.045±0.462 | 0.012 | |
| Exposure to occupational noise | 0.134±1.206 | <0.001 | 0.188±0.580 | 0.295 | 0.161±0.580 | 0.368 | |
| Exposure to explosive noise | 0.001±1.021 | 0.965 | –0.236±0.586 | 0.189 | –0.205±0.586 | 0.253 | |
AHT, average hearing threshold; US-β, unstandardized β; SE, standard error.
a) The dependent variable was the AHT levels, and the model 1 was adjusted for age, sex, presence of diabetes mellitus and hypertension, smoking habit, alcohol intake, and occupational and explosive noise exposure. Model 2 was adjusted for age, sex, presence of diabetes mellitus and hypertension, smoking habit, alcohol intake, occupational and explosive noise exposure, and lead level.
- 1. World Health Organization. Prevention of blindness and deafness [Internet]. Geneva: World Health Organization; 2018 [cited 2018 April 15]. http://www.who.int/pbd/deafness/estimates/en/.
- 2. Roth JA, Salvi R. Ototoxicity of divalent metals. Neurotox Res 2016;30:268–82.ArticlePubMedPDF
- 3. Ozcaglar HU, Agirdir B, Dinc O, Turhan M, Kilinçarslan S, Oner G. Effects of cadmium on the hearing system. Acta Otolaryngol 2001;121:393–7.ArticlePubMed
- 4. Kim SJ, Jeong HJ, Myung NY, Kim MC, Lee JH, So HS, et al. The protective mechanism of antioxidants in cadmium-induced ototoxicity in vitro and in vivo. Environ Health Perspect 2008;116:854–62.ArticlePubMedPMC
- 5. Choi YH, Hu H, Mukherjee B, Miller J, Park SK. Environmental cadmium and lead exposures and hearing loss in U.S. adults: the National Health and Nutrition Examination Survey, 1999 to 2004. Environ Health Perspect 2012;120:1544–50.ArticlePubMedPMC
- 6. Shiue I. Urinary environmental chemical concentrations and vitamin D are associated with vision, hearing, and balance disorders in the elderly. Environ Int 2013;53:41–6.ArticlePubMed
- 7. Korea Centers for Disease Control and Prevention. [Alcohol drinking] [Internet]. Osong: Korea Centers for Disease Control and Prevention; 2017 [cited 2018 April 15]. http://health.mw.go.kr/HealthInfoArea/HealthInfo/View.do?idx=5800&subIdx=4&searchCate=&searchType=&searchKey=&pageNo=&category=1&category_code=301301306&dept=3&sortType=date&page=1&searchField=titleAndSummary&searchWord=.
- 8. Kang JW, Choi HS, Kim K, Choi JY. Dietary vitamin intake correlates with hearing thresholds in the older population: the Korean National Health and Nutrition Examination Survey. Am J Clin Nutr 2014;99:1407–13.ArticlePubMedPDF
- 9. Choi WJ, Han SH. Blood Cadmium is associated with osteoporosis in obese males but not in non-obese males: the Korea National Health and Nutrition Examination Survey 2008-2011. Int J Environ Res Public Health 2015;12:12144–57.ArticlePubMedPMC
- 10. Agency for Toxic Substances and Disease Registry. Public health statement for dadmium [Internet]. Atlanta: Agency for Toxic Substances and Disease Registry; 2012 [cited 2018 April 15]. https://www.atsdr.cdc.gov/phs/phs.asp?id=46&tid=15.
- 11. Liu H, Ding D, Sun H, Jiang H, Wu X, Roth JA, et al. Cadmium-induced ototoxicity in rat cochlear organotypic cultures. Neurotox Res 2014;26:179–89.ArticlePubMedPMC
- 12. Thatcher RW, McAlaster R, Lester ML. Evoked potentials related to hair cadmium and lead in children. Ann N Y Acad Sci 1984;425:384–90.ArticlePubMed
- 13. Shargorodsky J, Curhan SG, Henderson E, Eavey R, Curhan GC. Heavy metals exposure and hearing loss in US adolescents. Arch Otolaryngol Head Neck Surg 2011;137:1183–9.ArticlePubMed
- 14. Kang GH, Uhm JY, Choi YG, Kang EK, Kim SY, Choo WO, et al. Environmental exposure of heavy metal (lead and cadmium) and hearing loss: data from the Korea National Health and Nutrition Examination Survey (KNHANES 2010-2013). Ann Occup Environ Med 2018;30:22.ArticlePubMedPMCPDF
References
Figure & Data
References
Citations
- Population‐based study of environmental heavy metal exposure and hearing loss: A systematic review and meta‐analysis
Fang Wang, Frank Böhnke, Katja Böck, Markus Wirth
Laryngoscope Investigative Otolaryngology.2024;[Epub] CrossRef - The role of calcium, Akt and ERK signaling in cadmium-induced hair cell death
Jennifer Galdieri, Chloe Adams, María Padilla, Tamara M. Stawicki
Molecular and Cellular Neuroscience.2023; 124: 103815. CrossRef
 PubReader
 ePub Link
 Cite
Cite